Data
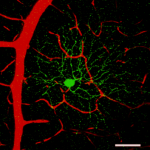
Neural circuits in the mouse retina support color vision in the upper visual field
Szatko KP#, Korympidou MM#, Ran Y, Berens P, Dalkara D, Schubert S, Euler T, Franke K*
BioRxiv 10.1101/745539.
#These authors contributed equally to this work;
*Senior author and correspondence
Downloads
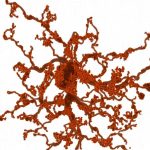
Type-specific dendritic integration in mouse retinal ganglion cells
Yanli Ran1,2,7, Ziwei Huang1,2,7, Tom Baden1,4, Timm Schubert1,2, Harald Baayen5, Philipp Berens1-3,6,#, Katrin Franke1-3,#, Thomas Euler1-3,#,*
Nature Communications, accepted.
7These authors contributed equally to this work; #Senior authors, *Correspondence
Downloads
- Custom scripts in Python, R and Igor for data processing, statistics analysis and plotting
- Code for receptive field estimation
- Relevant data
A Tale of Two Retinal Domains: Near Optimal Sampling of Achromatic Contrasts in Natural Scenes Through Asymmetric Photoreceptor Distribution.
Baden T*, Schubert T*, Chang L, Wei T, Zaichuk M, Wissinger B, Euler T (2013)
Neuron 80(5):1206-1217,
10.1016/j.neuron.2013.09.030.
*authors contributed equally
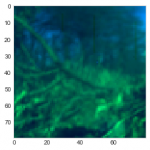
The corresponding dataset contains spectral image data of an early spring daytime forest scene recorded using a ‘‘hyperspectral scanner’’. For details, see publication.
Downloads
- 10.5281/zenodo.1204501 (dataset on Zenodo)
- github.com/eulerlab/published_data (basic visualisation routines in python; as jupyter notebooks w/ instructions)
Local signals in mouse horizontal cell dendrites
Chapot CA, Behrens C, Rogerson LE, Baden T, Pop S, Berens P, Euler T#, Schubert T# (2017).
Local signals in mouse horizontal cell dendrites.
Curr Biol 10.1016/j.cub.2017.10.050.
#corresponding authors
Downloads
- github.com/eulerlab/published_data (horizontal model; as jupyter notebooks w/ instructions)
Inhibition decorrelates visual feature representations in the inner retina
Franke K*, Berens P*, Schubert T, Bethge M, Euler T#, Baden T# (2017).
Inhibition decorrelates visual feature representations in the inner retina.
Nature 10.1038/nature21394.
*authors contributed equally, #corresponding authors
The corresponding dataset contains light-evoked bipolar cell signals from 13,311 regions-of-interest (ROIs, corresponding to individual axon terminals) recorded from the mouse retina. The data were obtained by two-photon glutamate imaging employing the genetically-encoded glutamate sensor iGluSFR and a standardized set of stimuli (see publication for details).
Downloads
- 10.5061/dryad.rs2qp (dataset on datadryad.org)
- Franke_et_al_2017_visualization (basic visualisation routines in MatLab)
- Datajoint schema used for data handling
Brief instructions
- Download the dataset (10.5061/dryad.rs2qp) from datadryad.org
- Run script.
The functional diversity of retinal ganglion cells in the mouse
Baden T*, Berens P*, Franke K*, Román Rosón M, Bethge M, & Euler T# (2016).
The functional diversity of retinal ganglion cells in the mouse.
Nature 10.1038/nature16468.
*authors contributed equally, #corresponding author
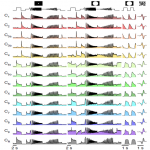
The corresponding dataset contains recordings of 11,210 retinal ganglion cells from the mouse retina obtained by two-photon calcium imaging with the synthetic calcium indicator OGB-1 to a standardized set of stimuli (see publication for details). In addition, the dataset contains morphological, genetic and immunohistochemical metadata, where available.
Downloads
- doi:10.5061/dryad.d9v38 (dataset on datadryad.org)
- Baden_et_al_2016_visualization (basic visualisation routines in MatLab)
Brief instructions
- Download the dataset (doi:10.5061/dryad.d9v38) from datadryad.org
- Load the data into MATLAB using:
data = load('filename.mat'); - Call plotOverview(data) to create an overview plot over all groups and plotStamp(data,5) to create an overview for a single group (here, for example, group 5).


